"Grouping Pivot Table" comes in rescue when we have a huge data on daily basis and we have to compile the data so it is not possible to make a pivot table on daily basis data then we have a option of Grouping Pivot Table.
What Grouping Pivot Table option does, it converts days wise data into "Months", "Weeks", and "Years" according to our need.
So this is the main reason of using "Grouping Pivot Table" option.
Like in the below given image we have the data for each single day, so if we have a huge data around 10 to 15 thousands of rows by date wise. So Grouping is the only option to make a Pivot Table reports.
The
below given pivot table is without “Grouping Pivot Table” option and we can see
that it is too long and difficult to calculate data accosting to individual
date wise but when we calculate the data by the Date which falls on the same
month, like the data of Jan, Feb, Mar, etc. then it will be very easy to create
a Pivot Table.
So for grouping the data simply right click on the pivot tale on the
date column and then select Grouping option it looks like as below given image
And
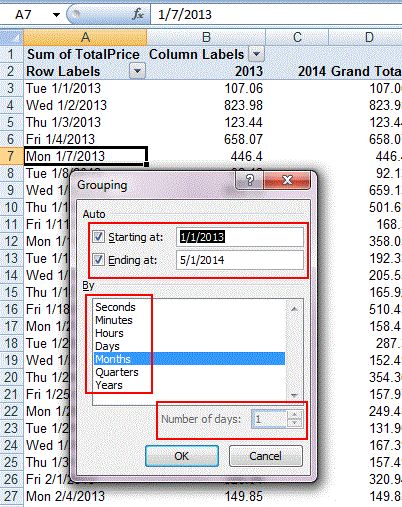
when we click on Group option it looks like the below given image
1st box you can see that “Starting at” and “Ending at” you can give the
start date by your choice and it will generate the Pivot Table according the
data select, it will only given range between the selected period.
2nd
box is the main box you can convert your data by “Years”, “Quarters”, “Months”,
“Days”, “Hours”, and so on as its mentioned on the list.
3rd
box represents that,” if you want weekly status then 3rd box comes
in rescue like you can increase that “Number of days:” by 7 and it will provide
the data according to weekly basis.
Now if you click on month and press “OK” button the following Pivot
Table will appear.
Now all the date have been convert into “Month”, this option will
cumulate all the date wise data in a month and all the month names are
appearing in the pivot table with the
cumulative data with column “2013” and “2014” respectively and the Grand total
as well.
This
is the month wise data and by the Group Pivot table we can generate the data by
“Year wise” also and “By the Month and Year wise also”. Like in this below
mention image the data will be according to “Year and Month”
Grouping Dates by Week
In the below given image we can generate the report by weekly basis also
by selecting the “Days” and increasing the “Number of days: 7” and then click
ok


No comments:
Post a Comment