Saturday, 22 April 2017

Excel VBA Introduction

What is VBA?

VBA is stand for “Visual Basic for Application” and it is a programming language. This is very easy and powerful language and it comes pre-installed with Excel. We use this VBA skill to automate Excel job or task to reduce the time.


VBA is also packaged with other Microsoft application like Word, Outlook and Access

What is a Macro?

Macros are small or long programme design in Excel VBA. In further tutorial we will discuss about macro in a detailed way.

Whenever we create a macro in Excel VBA, it will be started like:-

Sub Topic_we_want_to_create_a_macro
-
-  (in this place we will write some vba coding
-     and we will talk in details about it later posts)
-
End Sub

Here SUB (Short for Subroutine) is collection of lines of VBA coding and that coding is the main part of VBA macro.

But when we open Excel in our computer, the VBA option is not displaying there.


In above given image there is no Developer tab, Developer tab is the option from we can make the VBA option visible.

Follow the below given instruction and get a VBA Developer Tab is visible to the ribbon


In Excel 2007, open Excel and top of the Excel there Office Button (No. 1) click on it and a new window will open and at the bottom click on "Excel Option" (No.2), the following window will appear


First click on No.3 "Popular Tab" and make sure No.4 should be ticked and if it is not-ticked the VBA Developer tab will be disappear from Excel ribbon, so make sure that "Show Developer Tab in the Ribbon" is ticked and simply click on "OK" button. 

And once you done it, the Excel image will look like below image:- 


The "Developer Tab" is now available in the Excel Ribbon and once you click on "Developer Tab"
the another VBA option are also visible there,  like "Visual Basic", "Macro", "Record Macro", "Macro Security" etc are also available in the Excel Ribbon,

What is Macro Security?

Click on the "Macro Security" button as circled in the above image 

First we have to check for "Macro Security Setting" in the following given image:-


Make sure your Macro security setting should be exactly as mentioned in the above image.

What is a macro security setting? we will discuss this in a different blog because this is a detailed study.

How to save a Excel macro file?

Now one more thing need to discuss that whenever we will save a macro contains file, we need to   notice that click on "Save" button and from Option "Save as type" as circled, choose  "Excel Macro-Enabled Workbook", if we will not follow this, the macro is not going to save in our file.


Now working on "Visual Basic" simply click on "Developer Tab" and then click on "Visual Basic Tab" or simply type "Alt + F11"


Once you hit on "Visual Basic Tab" or type "ALT + F11" you will get the following 
image :-


No.1 is the "Project Explorer" all the "Module" will be stored in this project explorer window.

What is Module in Excel VBA?

Module are in which we write our macro programming code and Module are created from Project window as follows:-


For creating a Module Right Click on "VBAProject" and click"Insert" and click "Module".

Following image will appear


There are another important windows, showing in below image:-
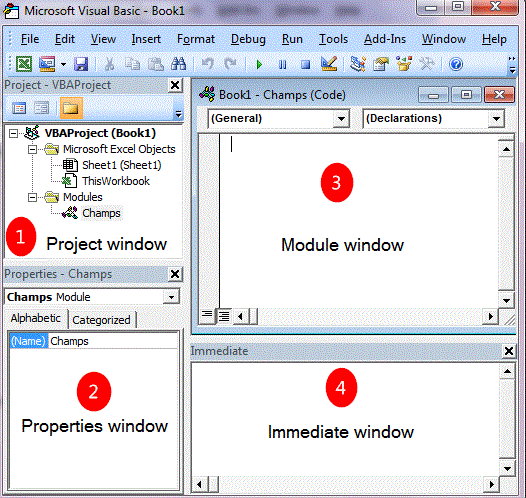

1.  Project window

Project window contains all Module

2. Properties window

Properties window can change the properties of the module, change the name of Module or etc.

3. Module window

We write all the VBA coding in the Module window only

4. Immediate window

Immediate window is very useful and we will discuss about this window in future blogs.

Create My First Macro

First of all go to the Module window and simply type Sub and the name of Macro "My_First_Macro"
and a simple coding " MsgBox "Hello World" 


And run the macro by pressing the Red Circle Button in above image and following outcome will appear


VBA coding create a Msgbox containing a message "Hello World"

So this the First VBA post by "Developer Tab" to create a simple macro. This tutorial shows that there is nothing in complicate in VBA, it is just a simple language but as we will go deeply in VBA we will find some little bit difficulty but if we will not miss any topic then it will benot be so difficult as we think.


Goodbye for now

Narendra
Monday, 17 April 2017

Pivot Table Calculated Field


Pivot Table is so powerful tool in excel that it can calculate a huge excel data with few seconds with 100% accuracy and it has many option to calculate the data the way we want to create the reports. “Calculated Field” and “Calculated Item” are the tool in Pivot Table that we can create our own demanded calculation in a separate column.


Make sure that your cursor is in any cell of Pivot Table


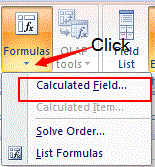
Go to à Optionà FormulaàDropdown arrowà


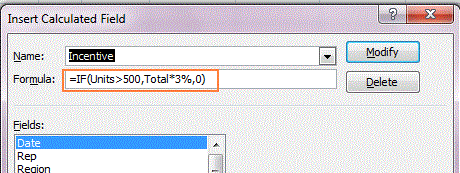
Click on “Calculated Field” and following box will appear, in this box you can see that in the field of “Field” area there are several topics “Region”, ”Product”, ”Customer”, etc. All topics are from our Pivot Table.

With the help of these Field headings we can create more formulas and can get more results with the help of "Calculted Fields" and "Calculted Items" option, and example is given below:-


All the topics in this box are from the below given pivot table 


In this pivot table you can see if we want add a “Profit” column then simply apply the formula of “Calculated Field” à

àOption tabàFormula Tabà Click dropdown arrow àClick "Calculated Field" below box appear

Put the cursor in “Formula” field and “double click on Revenue” – (subtraction sign) “double click on COGS”, the formula should be like =Revenue - COGS, just like the below mention..

And simply click on “Add” button and simply click "OK”


When you click on “OK” our Pivot Table will look like  below given image, a new field of “Profit” is added in the Pivot table and with its calculation “Sum of Profits”


So this is the simple way by adding another field in the pivot table.


And simply click OK then following image will appear


One more complicated example

In this below given example we can use  “If” (Logical) conditioned based formula


After click on “OK” button, we will get the below given result


How to remove calculated field temporarily 


Now we if we want to remove “Calculated Field” temporarily then we will simply click on pivot table and press “right click”, simply remove it by below highlighted box.


How to remove calculated field temporarily

If we want to remove “Calculated Field” permanently then we will follow the below given instruction:-

1.      Click on Pivot Table
2.      Go to Option Tab
3.      Click on Formula Button drop down arrow
4.      Click on Calculated Field
5.      Calculated Field box appear
6.       Click on the drop down arrow and look for field you want to delete
7.      And simply delete it or you can modify it also by click on modify button.


List of All the Calculated Fields

1.         Click anywhere in the Pivot Table
2.         Go to Formula tab drop down
3.         Select for "List of Formulas" and Click 


A new sheet will be generated in the workbook,  with a list of "Calculated Fields" and "Calculated Items"


Pivot Table has more feature with "Calculated Fields" and "Calculted Item" like "Problem with Calculted Fields" and "Calculated Items", we will discuss more about this feature in future blog.

Till then good bye

Narendra

Monday, 3 April 2017

Filtering Data in Pivot Table


The use of Pivot Tables are so common in offices now-a-days, so everyone must need to know all the trick of it because it is one of the power full tool.

So in this tutorial we will discuss about the Pivot Table filters. There are a lot off filters in Pivot
Table. We will discuss a few in this tutorial but if you follow all the tips  provided in this tutorial, you will become the master of Pivot Table Filters.

We will start the discussion from the below given Pivot Table image.


The above given data table is Pivot Table in which we have the data by date wise and we will apply some rules in this Pivot Table to get the result by our need.

1.  Top 10 Values from Given Pivot Table

Now we want Top 10 values from this Pivot Table because this is so lengthy, so what to do for that

simply put the cursor on "Row Labels" drop down menu and click and following image will appear


Click on "Row Labels" and then click on "Value Filters" another menu open and simply click on the last button "Top 10" when we click on "Top 10" button, following image will appear 


And simply click on "OK" button the following image will appear


And this is the result of "Top 10" values from the given Pivot Table Data.

This is the result of "Top 10 Data" and and by the same way if we need the result of "Top 5" or "Top ?" we will change the figure "5" in place of "10" and so on.

Now one more thing if we want to change the result by "Ascending or Descending" order we will follow the below given image instruction


Just put the cursor on Pivot Table data field and click on the "Oldest" and "Newest" button this is simply  A to Z or Z to A.


2. Filter Pivot Table for Bottom 10 Items

In the above example we discussed about "Top 10" items from Pivot Table and now we will discussed about "Bottom 10" items. This below given image will give you about the "Bottom 10" values in the Pivot Table.


3. Clear the Filters

Now in this topic we will learn that if we have applied for any kind of filter and we want to remove it to apply another filter so below given image will teach this thing.


Simply click on "Clear Filter From" button and if filter is applied then it will remove the filter and data will look as usual.

4. Mote  Filter Option

Now we will learn a little more about filtering in Pivot Table. As we learn that "Top 10", "Bottom 10", "Clear Filter" but this is not the end of Filter option in Pivot Table. There are some more filter in Pivot Table. Below given image will make it clear


When we click on "Row Label" drop down the above image will appear and then click "Value Filter" another menu will appear and there are  lot of option like "Equals", "Does Not Equals", "Greater Than" and so on...

And another image is for another filter option, first focus on below given image


In this image we will click on "Date Filter" a long list of filter option will appear like "Equal", "Before", "After" and so on.

There are multiple option of Pivot Table filter as we discussed in this tutorial . Filtering in Pivot Table is not difficult but to start doing this, it will become so easy to become expert.


Regards

Narendra

Monday, 20 March 2017

Grouping Data In Pivot Table

    
"Grouping Pivot Table" comes in rescue when we have a huge data on daily basis and we have to compile the data so it is not possible to make a pivot table on daily basis data then we have a option of Grouping Pivot Table.

What Grouping Pivot Table option does, it converts days wise data  into "Months", "Weeks", and "Years" according to our need.

So this is the main reason of using  "Grouping Pivot Table" option.

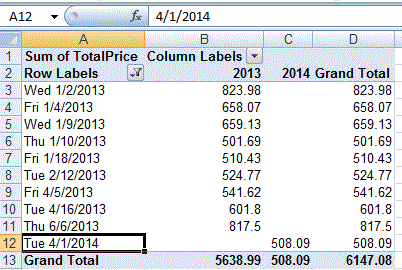
Like in the below given image we have the data for each single day,  so if we have a huge data around 10 to 15 thousands of rows by date wise. So Grouping is the only option to make a Pivot Table reports. 


The below given pivot table is without “Grouping Pivot Table” option and we can see that it is too long and difficult to calculate data accosting to individual date wise but when we calculate the data by the Date which falls on the same month, like the data of Jan, Feb, Mar, etc. then it will be very easy to create a Pivot Table.

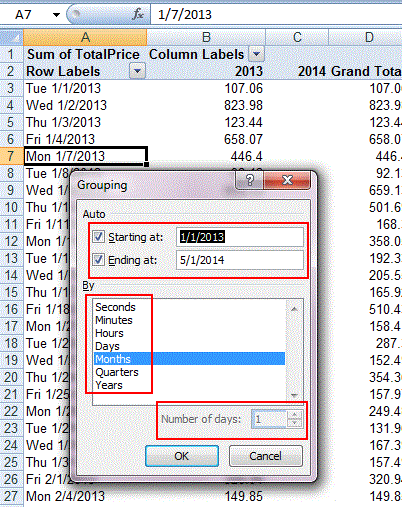
So for grouping the data simply right click on the pivot tale on the date column and then select Grouping option it looks like as below given image

And when we click on Group option it looks like the below given image


1st box you can see that “Starting at” and “Ending at” you can give the start date by your choice and it will generate the Pivot Table according the data select, it will only given range between the selected period.

2nd box is the main box you can convert your data by “Years”, “Quarters”, “Months”, “Days”, “Hours”, and so on as its mentioned on the list.

3rd box represents that,” if you want weekly status then 3rd box comes in rescue like you can increase that “Number of days:” by 7 and it will provide the data according to weekly basis.

Now if you click on month  and press “OK” button the following Pivot Table will appear.


Now all the date have been convert into “Month”, this option will cumulate all the date wise data in a month and all the month names are appearing  in the pivot table with the cumulative data with column “2013” and “2014” respectively and the Grand total as well.

This is the month wise data and by the Group Pivot table we can generate the data by “Year wise” also and “By the Month and Year wise also”. Like in this below mention image the data will be according to “Year and Month”


Grouping Dates by Week

In the below given image we can generate the report by weekly basis also by selecting the “Days” and increasing the “Number of days: 7” and then click ok


When we click “Ok” button then we will have the  below given image


So this tutorial was completely dedicated for Grouping in Pivot Table and there are another       
more feature in Pivot table, we will discussed in further tutorials.


Narendra

Tuesday, 28 February 2017

Pivot Tables


Pivot Tables are one of the most useful tool in excel, and most excel experts says that
this tool is the magic tool for quickly prepare report from huge data  set within a few   second.  

This is so useful and powerful tool that within a few second we can make report according to our need. We will learn here in details about Pivot Table beginning part. Below are the screenshot of the data set from which we will prepare the report.
               

Saturday, 24 December 2016

Vlookup formula for multiple columns

  Hi friends,
            Today we learn about how Vlookup can retrieve the value of  multiple columns from a single 

formula.


Lets learn the matter with the following example :


We have a table above with Name in column A and East, West, North, South in the row 1 field and 

table has some random data within the table range from A1:E7.

Now to understand the example in a better way we have to draw a second table with no data, is 

mentioned below:

Now we have a blank table and this table has no data and with the help of given data in Table1 there 

is one way we are familiar with i.e. simply type formula =VLOOKUP(H1,A1:E7,2,FALSE) but  
this formula is basic formula and to look for each record we have to type the formula every single 

time, but today we will discuss about a single formula to drag all the cell result.


So here is another table to understand it in better way.
I have typed the formula above and described it below


1.       Lookup_Value      :  We are looking the value of H1 in column I1 from Table1

1.       Table_array          :  We will the find the value of this cell from  table range $A$1:$E$7 (Table1)

1.       Col_Index_num   :  Now this is the main field column, we will look for the value of each column
    
                                               by typing the vlookup  formula in each column, but by the help of vlookup columns
                                           
                                               formula we do not need to type the vlookup formula each time, we will                                                  
                                       understand it from above mentioned example(Table3).
      
        False                   :  And the last argument is True/False(Approximate/Exactly)


In the above mentioned example you are watching that there are $ sign in the formula, this $ has a 

important role in formula writing in Excel and we can put this $ by pressing F4 key repeatedly to get

 the result accordingly. This $ sign fixing a row or column i.e. $H1 (H: Column, 1: Row), 

$H1  column  (H) will be freeze and will not change but row 1will change whenever we will drag it 

right  or down.

So if you will exactly type the above formula in the table and press Enter, it will retrieve all data from  
Table1, all fields will get their data automatically.


I  will give a separate post for Absolute Cell Reference  later 

Now focus on third arguments i.e. Col_index_num COLUMNS($B1:B1)+1

Here is the detailed description $B1:B1 represents the same column but  when  you drag it first $B 

will be  remain same and second B will be change to C, D, E, F and so on and after closing the 

bracket type +1 and it will automatically look for the next column, you can see by deleting the +1 

from the formula and see then what happened. 

So friends , soon I will be back with another useful post 

goodbye for now


Narendra

Monday, 1 August 2016

The Vlookup Guide

    
      Today we will discussed about the most useful topic of advance excel, so for us it is necessary to know that how to use this function and why this function is so much useful.

First we will understand that what is vlookup and why this is so important so first we will put a little 

look what is vlookup.

VLOOKUP, V stands for "vertical" which mean use VLOOKUP to lookup values in table that's 

arranged vertically. And the same for Hlookup stands for “Horizontal” but we will discuss that in later.

                         VLOOKUP (Lookup_value, table_array, col_index, [range_lookup])
                                                    (1)                     (2)             (3)                   (4)

(1)    Lookup_value          The value to look for in the first column of a table
(2)    table_array               The table from which to retrieve a value.
(3)    col_index_num       The column in the table from which to retrieve a value.

(4)    range_lookup           [optional] TRUE = approximate match (default). FALSE = exact match.

Here is the example:-


Here we will discuss about one by one but for the clarity we need one table to understand the picture clearly.


Here in this above image we can see that row no 3 is highlighted, suppose that  we have only cell value “George” in cell A3 and we have to look for the cost of “George”or we need to find the value of “Profit” of “George” so in this case we can use vlookup and after using vlookup we can get the value easily. How to find the value of “George”  in the column of “Cost” or “Profit”, see how it happens :- 


Simply type =Vlookup(1,2,3,4)

                    =Vlookup (lookup-value{ we are looking for},table-array{total table area from A1 to D9},col-index{in which column we the value is exist},[range-lookup]{iether we want exact value or near about}               
Now we need to put the value in the above format
       =Vlookup(A13,A1:D9,3,False)

      A13      =we are looking for “George” value in cost column so “George” is located in cell A13.

      A1:D9  =total table area, we can easily seen that total  data is from cell A1:D9
     
      3          = 3 is the column no. where my value is located

True/False =    and last argument is True/False which means either we want the value exactly or near about will do.      


After putting these value into the formula and press enter, you will get the result that “George” gave “7412” value in column 3 and if in the formula we will change column no. “4” instead of “3” you will get the result  from 4th  column i.e. = 12025 the value of “George” is located in column no. “4“


Limitations of Vlookup

Vlookup has some limitation and in the following example we will discuss about it.

1.        Vlookup will always look for the data from extreme left to right, not from mid to right , in the below given image  vlookup will find the data from Column A to Column D not form Column B to Column C  or Column D. 


We can understand it from below given example :-

 We have cut a piece form above image to understand this better way and in this below given screenshot we can  see that column (H) and column (I) are blank but we can find the value for both the places.


By the vlookup formula if we want to look for the value for H2 and I2 the formula would be

=Vlookup(F2,Table array would be (A1 to D9), column no would be 3 or 4, and last step  is True/False)

True stand for = Match nearest value
False stand for = Match exact value

I want to say from this example we cannot find the result by putting the below given example

=Vlookup(G2,Table array would be (A1 to D9), column no would be 3 or 4, and last step  is True/False)
=Vlookup(G2, A1 : D9, 3 or 4, False)

If we are applying this formula so we have to take notice that when we will look for G2 so the table array would be B2:D9 not by A1:D9 if we follow this the result will be come out because in this case column B2 would be extreme left.

2.   Vlookup will not look for the data from right to left, example below :-

You can see in the below given image the limitation of vlookup that it cannot look the data from right to left.

3.      If we have applied vlookup formula somewhere and we will insert another column in the table array field so everywhere we have applied vlookup formula (only those formulas which has the base from that table array field) all the formula will not produce the correct result because vlookup will count the column no. and then give the result but if we insert another column in the table array field the result would not  be the same.      


In the below given image we can see that when we insert a column before the Sales column the result is not the same and now it is a blank cell. Here above in formula bar you can see that the formula is same as it is appearing in the above image but in above image the value appeared after vlookup formula applied but in the below given image the value is not appearing but the formula is same to same, only difference is we have inserted a column before sales column.


So all this is happening because vlookup has a limit that if we insert a column between the table array it will not produce the same result.


So all these are the limitation of vlookup we have solution for the same also, like if column inserted so we have the solution, even how vlookup goes to left. 

All we will discuss in the  future tutorial.

Till then

Good bye

Narendra 

Featured post

Pivot Tables

Pivot Tables are one of the most useful tool in excel, and most excel experts says that this tool is the magic tool for quickly prepar...